How To Set Data-Driven Alerts in Google Analytics
I’m going to share this solution with you. It’s so simple, but powerful. Using this approach you will be able to set alerts that work. These alerts won’t disturb you with false notifications and they will capture key incidents with your data.
3 years ago, disaster struck.
I was working in an advertising agency. A week before a monthly results meeting with a client, we realized that client’s landing page hadn’t worked for 3 days. Nobody knew, not us and not the client.
We were running Display & Video 360 and a Facebook campaign on that landing page and we thought everything was fine. You can imagine how tough this meeting was. It was one of the hardest meetings of my career. The client was furious with us for not noticing, though we knew the fault came from the client’s team. But that didn’t matter. As an advertising agency, part of our job was to foresee problems and proactively mitigate them.
Of course, we weren’t about to start blaming anyone for the failure. We went to the meeting full of ideas of what to do and how to react faster in the future. Our key idea was to leverage the power of custom alerts in Google Analytics. It seems obvious, but you might be surprised that usually, less than 10% of marketers use custom alerts because of their limitations.
We set up alerts for that client to tell us if conversions dropped by more than 20% compared to the same day the previous week. Problem solved? Not yet. Because we then received an alert right the next day, which turned out to be false. And then we received the same false alert after another couple of days.
We realized that if the false alerts kept coming, we would end up ignoring them. And then we’d inevitably end up ignoring an alert that wasn’t false. This continues, we will stop reacting on alerts at all. Even if one of these won’t be a false.
We turned to Google to find a solution. We had to figure out what to do using the alerts in Google Analytics. Our analysts came up with a brilliant approach based on our data. It wasn’t complicated, but it did require some Excel skills and a bit of time, both to build the alerts and to keep settings updated as the data changed.
I’m going to share this solution with you. It’s so simple, but powerful. Using this approach you will be able to set alerts that work. These alerts won’t disturb you with false notifications and they will capture key incidents with your data. You’ll just need to update all your settings once every week or two. When my analysts shares this principle with me, I thought “why I didn’t come up with this first?”
I’m going to assume you know the basics on how to set alerts.
To start, you’ll need to choose the metric and dimension you want to track. In the example below, I’ll set alerts for session drops and increases for the CPC channel. But you can set alerts for other channels and other metrics, like conversion rate or revenue. This is up to you.
To start, you’ll need to choose the metric and dimension you want to track. In the example below, I’ll set alerts for session drops and increases for the CPC channel. But you can set alerts for other channels and other metrics, like conversion rate or revenue. This is up to you.
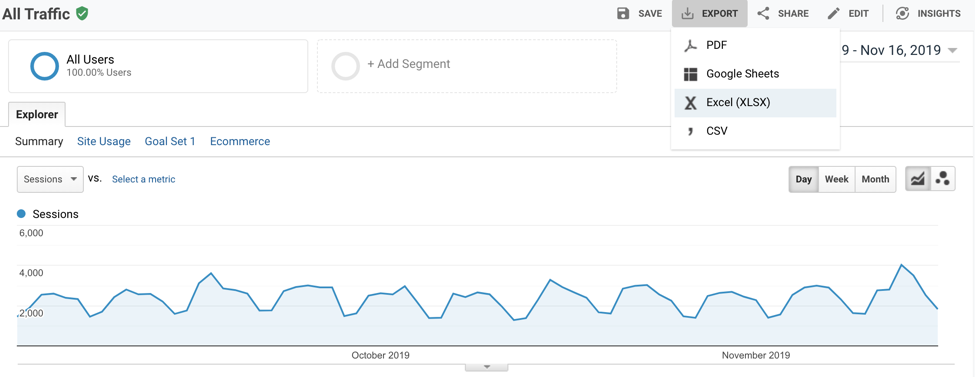
Then, open an Excel document and find a tab called “Dataset2”. This contains daily data for a metric chosen on a chart in your Google Analytics report.
In this tab you will see something like this:

Next, we need to calculate week over week change in %. Usually I recommend using a percentage if you have enough data. Also, I prefer to set week over week change alerts to mitigate seasonality in data. In my case, I have very strong weekly seasonality: during weekends we got significantly fewer sessions than on working days.
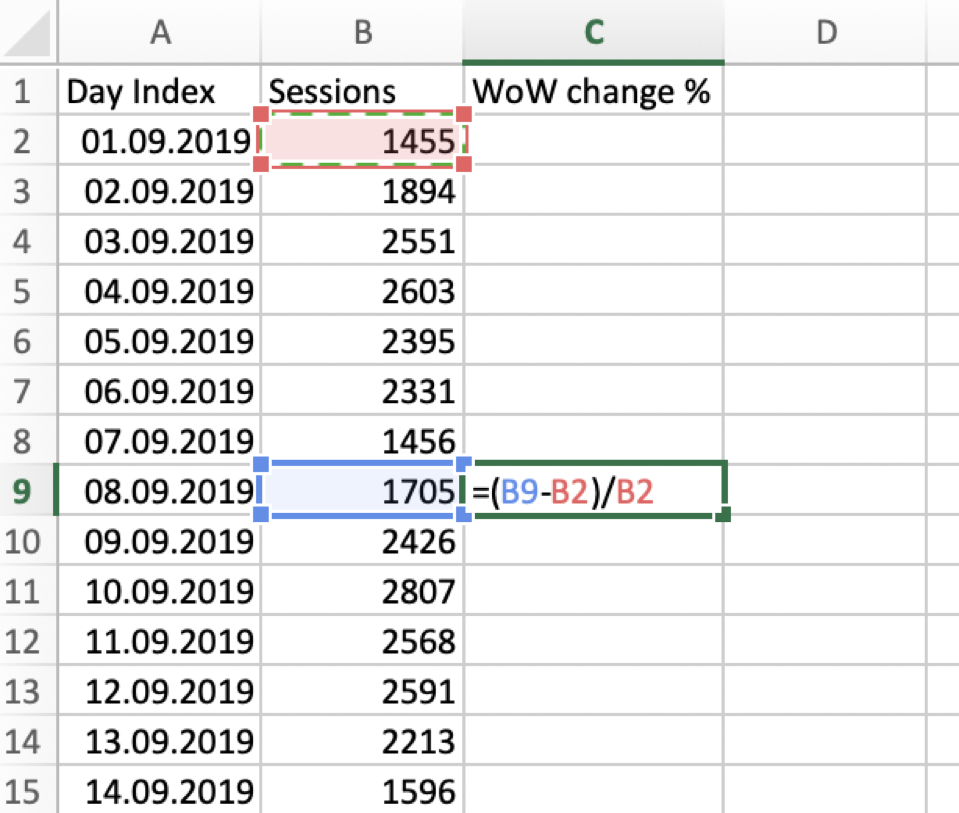
A very simple formula is used for that: ( current_value — last_week_value ) / last_week_value. For small amounts of data (like less than 500 sessions/conversion a day) I would suggest to subtract, like this: current_value — last_week_value.
If you have zeros in your data, so if on some days you got zero conversions or sessions, it might be wise to switch to weekly reports instead of daily.
And then, just copy this formula down to the bottom of column.
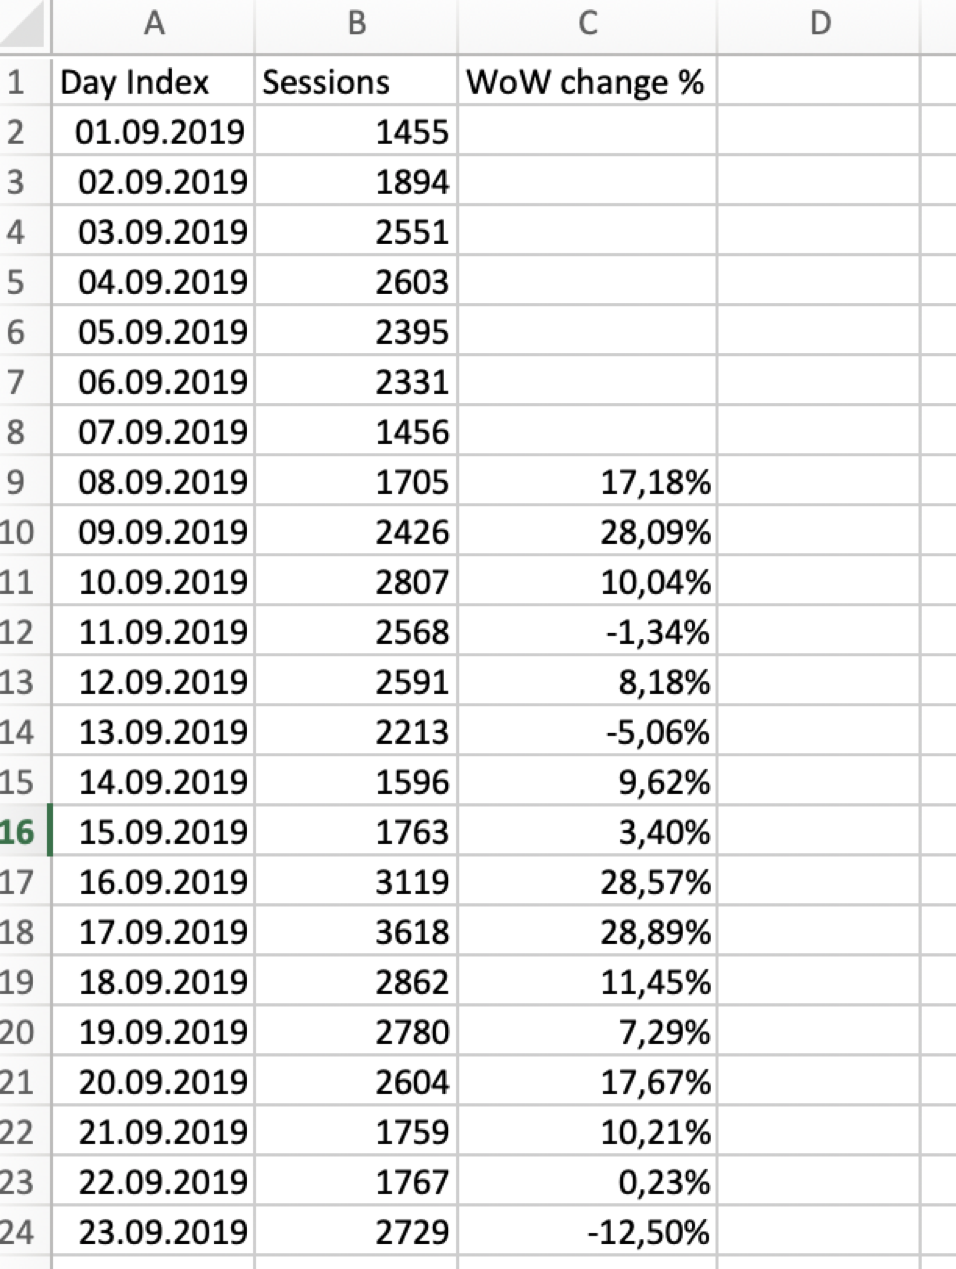
At the end you will get something like on the screenshot below. (I’ve formatted this one to make it look better).
Now we’re very close to our solution.
You just need to draw a chart for the last column. This chart going will illustrate how much your data usually changes.
I’ve got this:
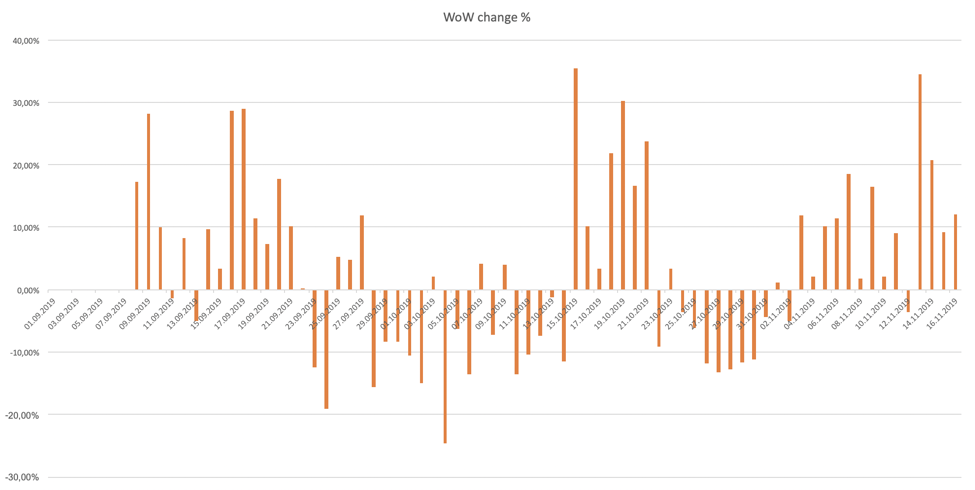
It represents a % of change, week over week, for each day. If I pick a value for the 10th of October, it will show my by what percentage the number of sessions changed that day, compared to the same day in the previous week.
All these steps are needed to us to understand normal behaviour for your metric (in my case it’s sessions). You can do the same math for revenue, or conversion rate, or any other metric in Google Analytics.
Now, we’re almost ready to set thresholds for our data-driven alerts, but first I would recommend to cleanse your data.
What do I mean by cleanse?
Imagine that we ran a big new campaign a month ago. Of course this will be reflected in our chart. Due to the nature of change, this is not normal behaviour. We need to exclude that day from our chart.
Again, our goal is to determine the normal rate of change for our session. If some of the days are not “normal’’, they should be excluded.I personally just replace this cell with a zero.
To investigate whether you’re seeing normal behaviour or not, open the Google Analytics report with two dates to compare: the date that you are interested in and same day the previous week.
After cleansing the chart, we can define our threshold for custom alerts.
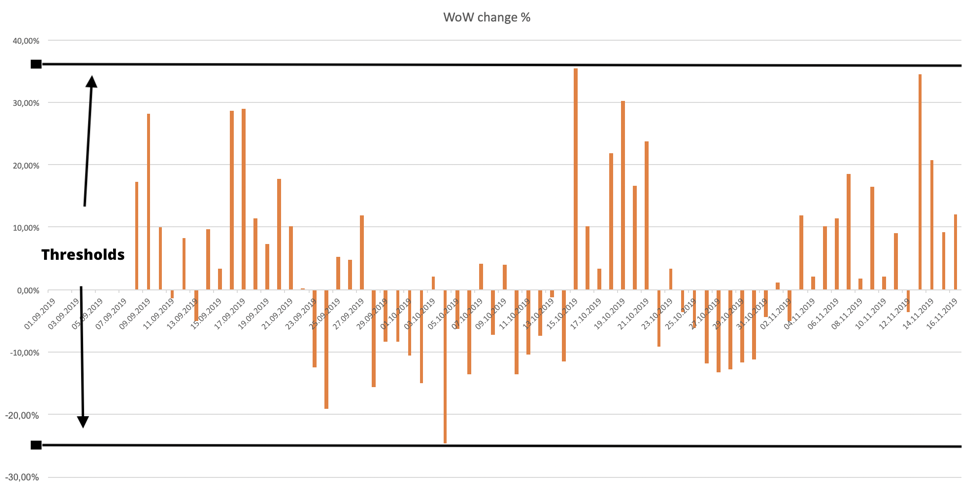
Here is an example of a best fit threshold, which represents: 37% increase, 25% decrease.
I used maximum values to determine thresholds.
Shares
 Share
Share
 Tweet
Tweet
 Share
Share
 Share
Share