Guide to Google Analytics Alerts [+ real-time alerts]
In this guide you will learn:
- How to set alerts in Google Analytics
- Set strong boundaries for your alerts
- How to set hourly alerts
- Alerts: ideas and use cases
- Easily manage your numerous alerts
Creating Custom Alerts in Google Analytics
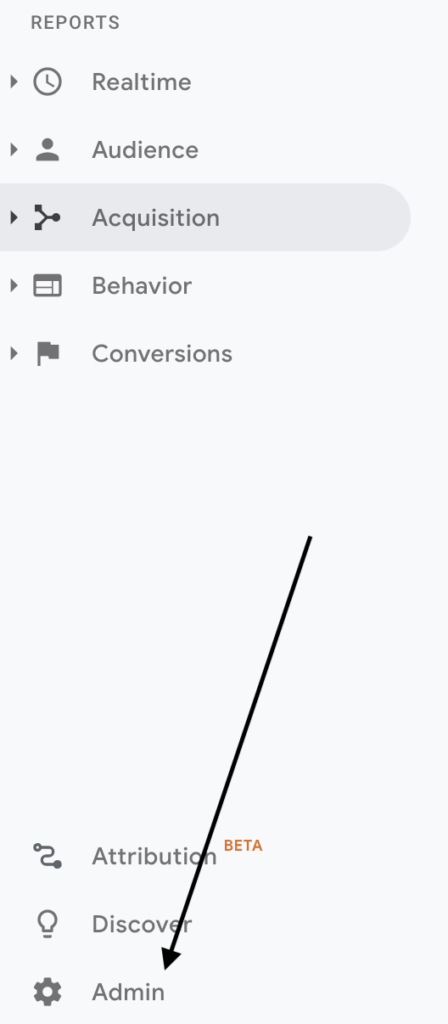
- Make sure the website properly that you need is open, and navigate to the Admin option:
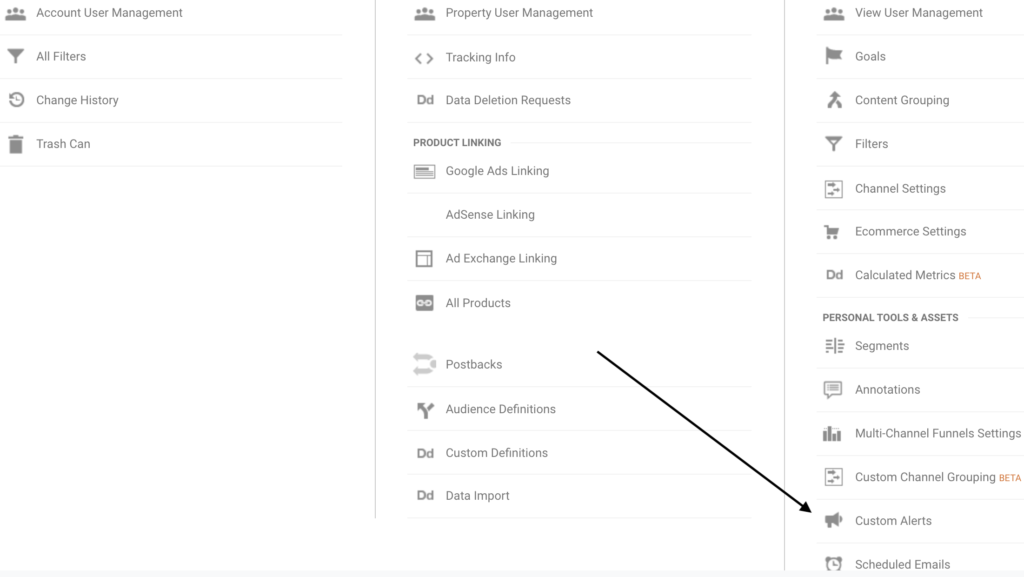
2. Then, click on “Custom Alerts” in the third column. Make sure you scroll down the page.
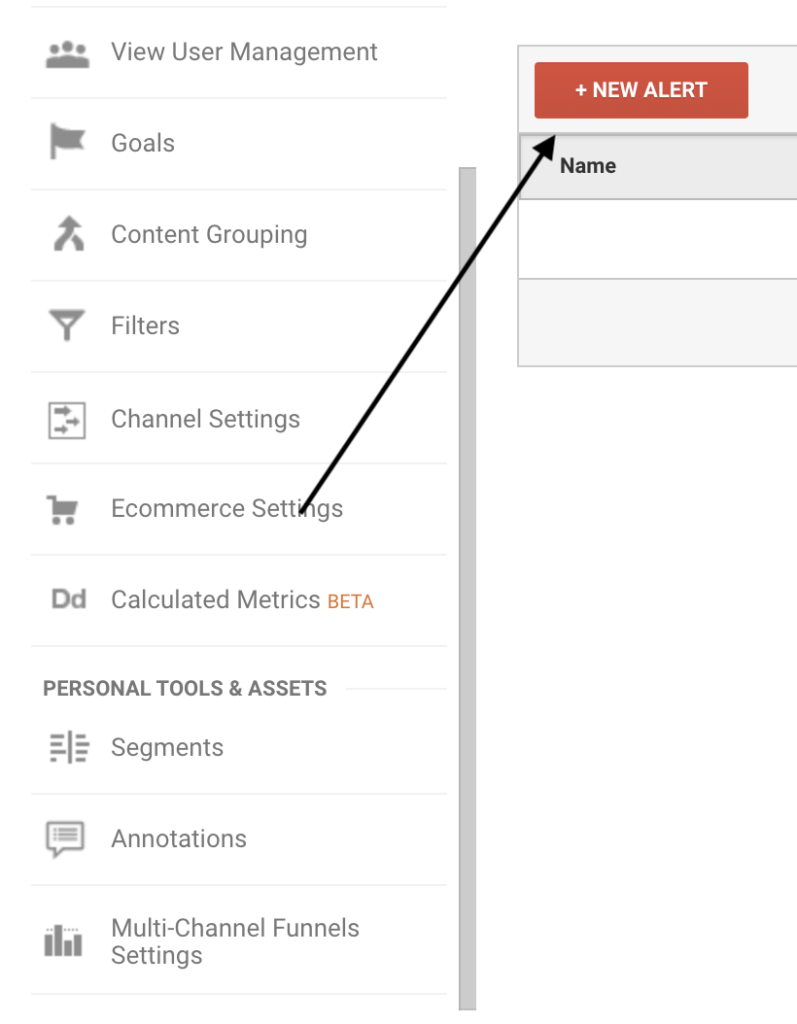
3. Click on a “+ New Alert” button
4. Here you can set-up all the settings:
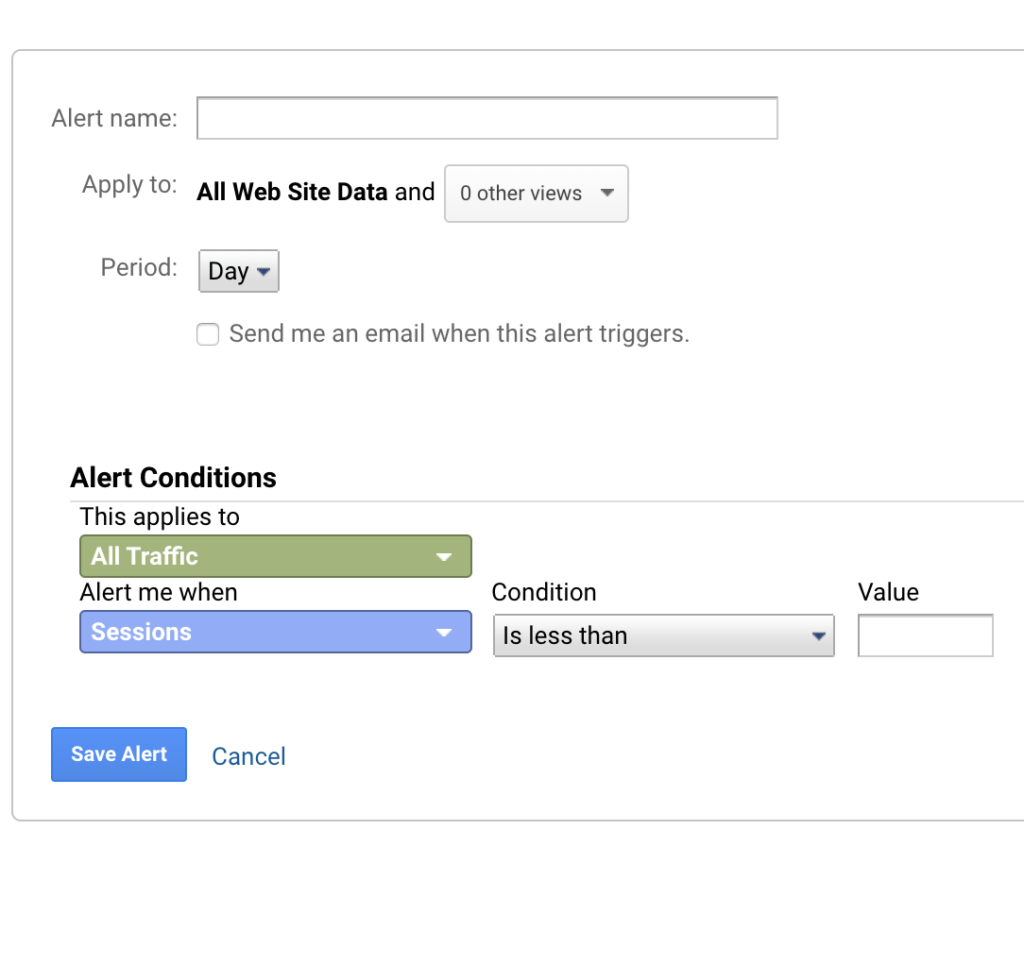
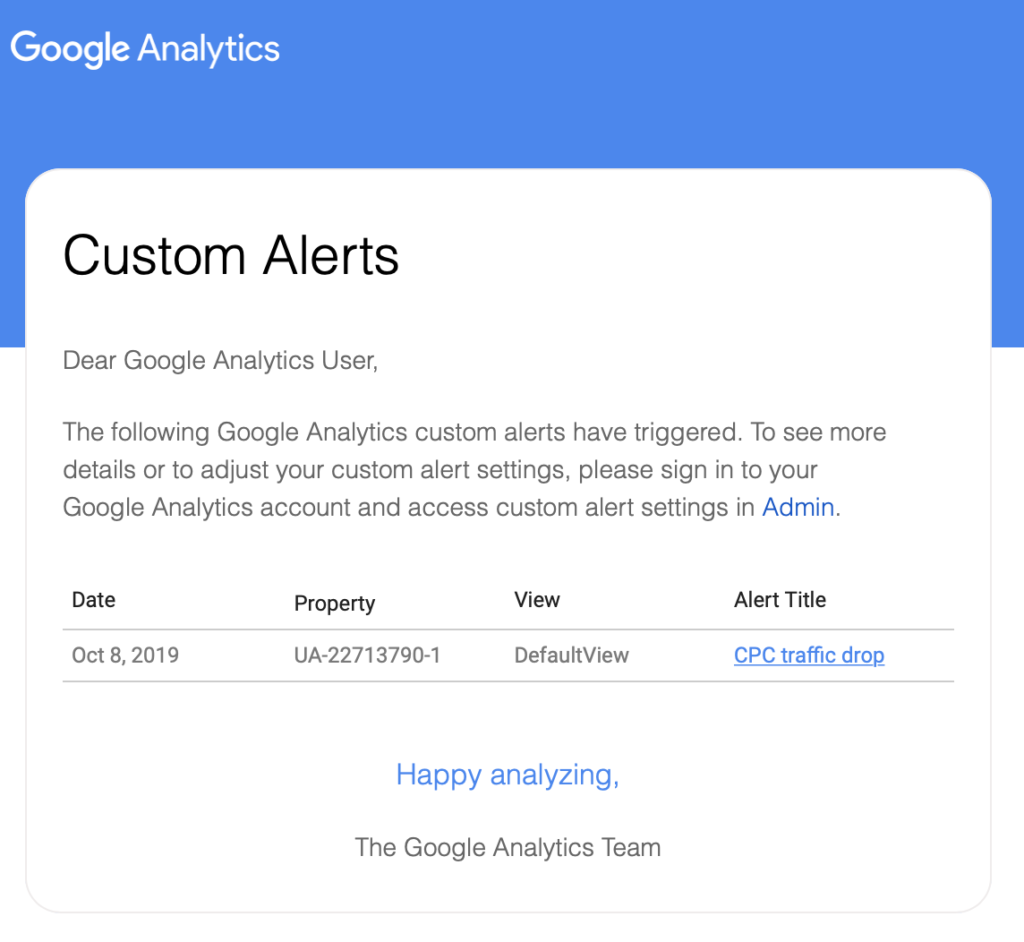
Once an alert triggers, you will receive an email like this:
How to set strong boundaries for your alerts
You don’t want to be annoyed by tons of false alarms and end up ignoring your alerts completely. At the same time you don’t want to miss an important spike in your data.
This is what balanced and strong boundaries are needed for.
Many people define their alert settings at 10% and forget about it.
Before you do this, I highly recommend reviewing your data.
This is how you do it.
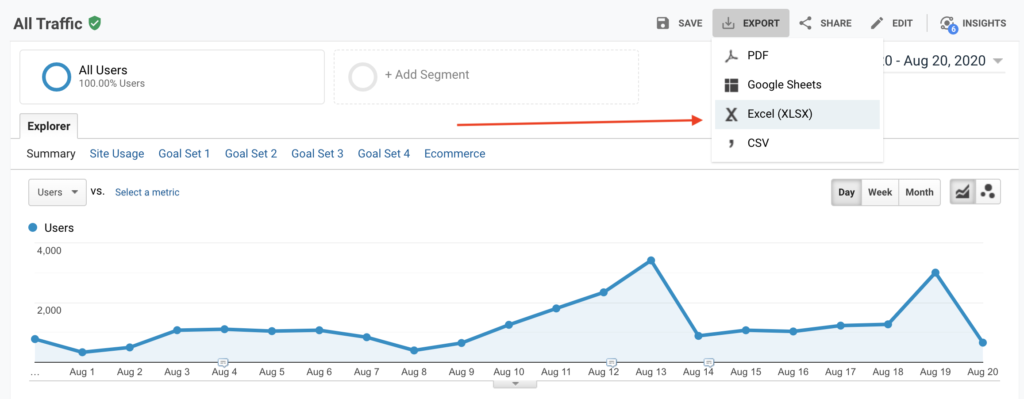
1. Download your data into Excel. Make sure you’ve selected a sufficient data range. For daily reports 60 days should be fine, for weekly - consider at least one year of data.
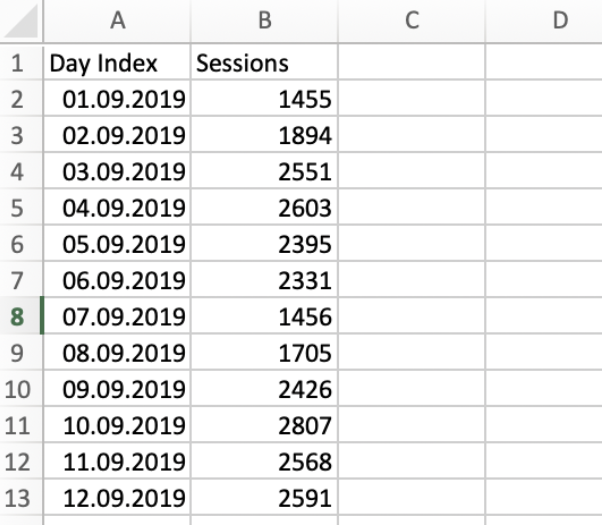
2. In this Excel document you need the “Dataset2” tab. Open it.
You will see something like this:
3. The next step is to calculate week over week changes as percentages.
If you have enough data, I usually recommend using a percentage. If you have high fluctuations in your daily data, consider absolute change.
Also, I prefer to set week over week change alerts to mitigate seasonality in data.
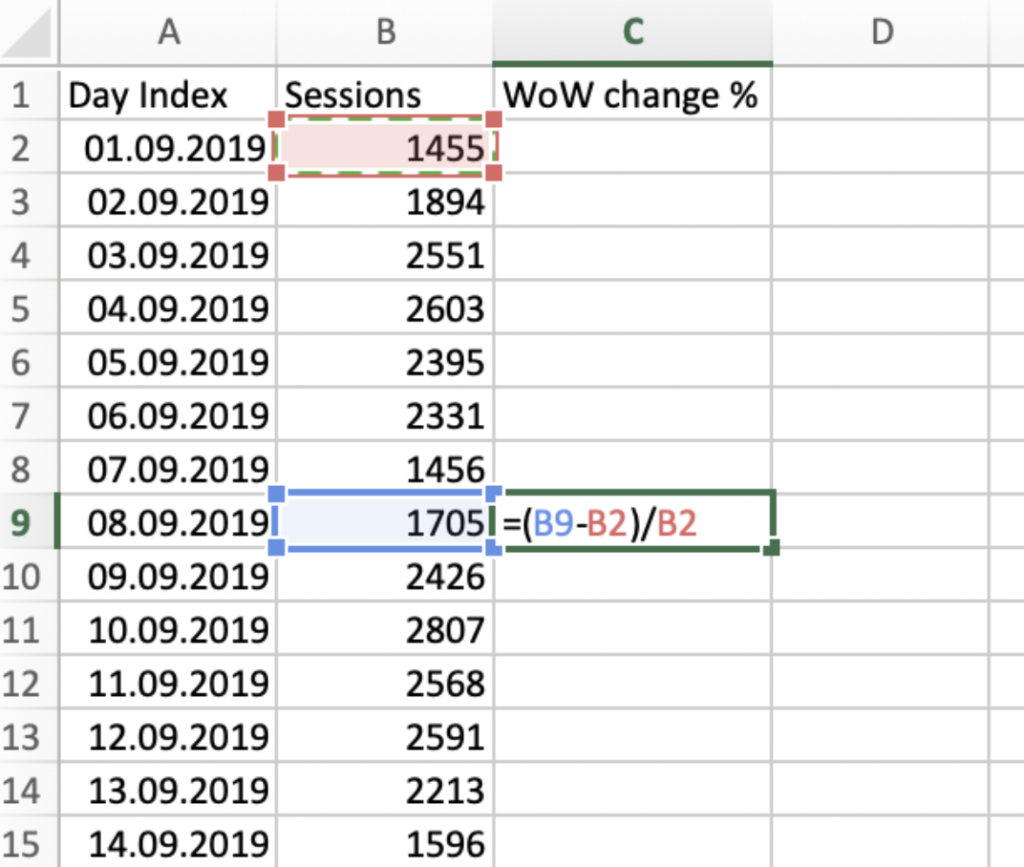
A very simple formula is used for that:
( current_value - last_week_value ) / last_week_value
For small amounts of data (like less than 500 sessions/conversions a day) I would suggest to substract, like this:
current_value - last_week_value
If you have zeros in your data, it might be wise to switch to weekly reports instead of daily.
Later on simply copy this formula down to the bottom of the column.
It should look like this.
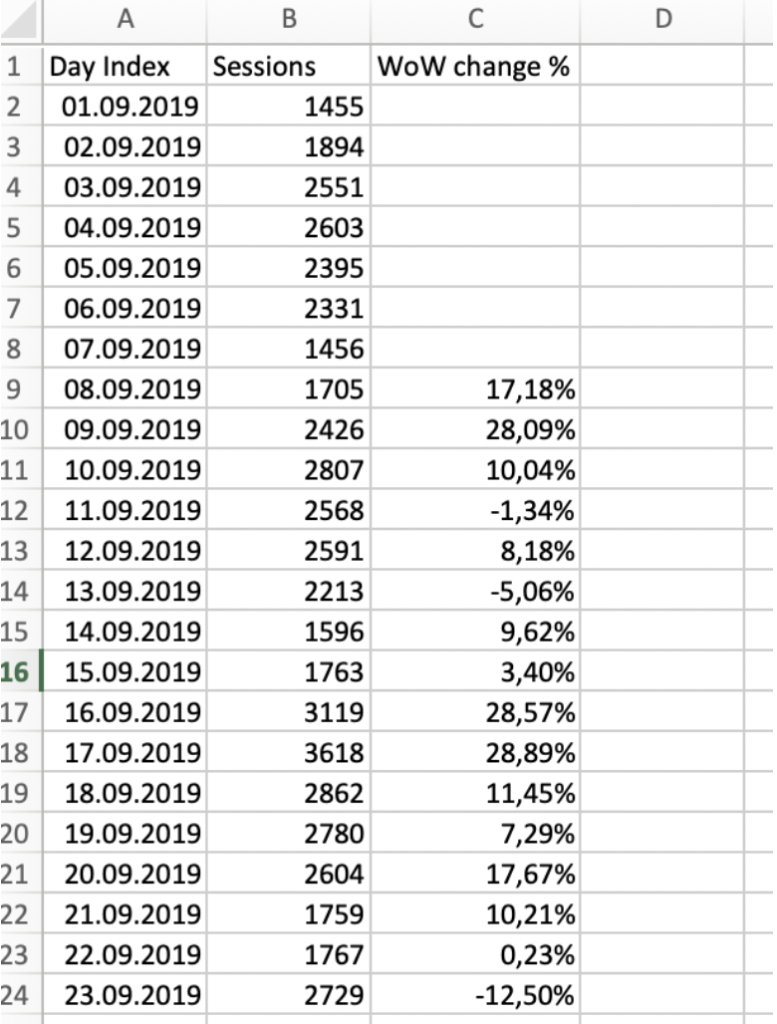
Remember, you need to skip the first 7 days, due to the fact that you don’t have anything to subtract from.
Then select this new column and plot a graph with all this % changes.
I’ve got this:
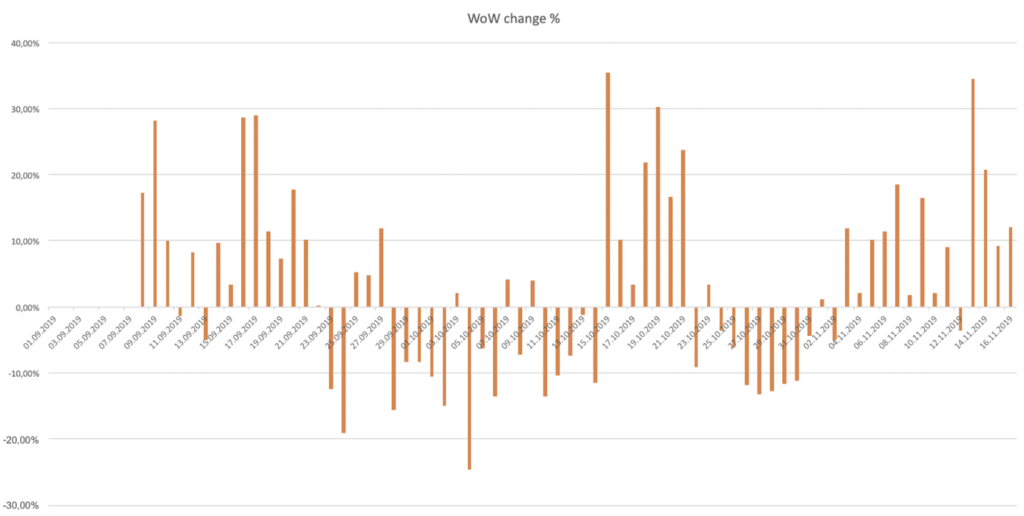
If I pick a value for the 10th of October, it will show by what percentage the number of sessions changed that day, compared to the same day in the previous week.
All these steps are needed in order for us to understand the normal change rate of your metric. In my case it’s “sessions”, but you can pick any.
This method works for any metric, and you can do the same math for transactions, conversions, bounce rate, etc.
Now we can define our threshold for custom alerts.
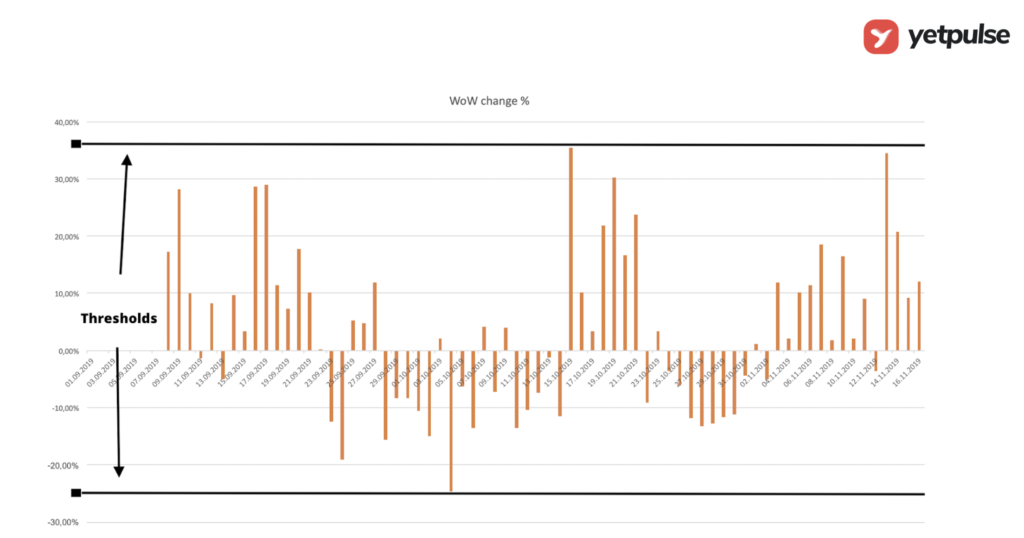
Here is an example of a best-fit threshold, which represents a 37% increase and a 25% decrease.
I have used the maximum values to determine these thresholds.
One more thing before you set your custom alert: if you have huge spikes on this graph then you should investigate them.
It might be caused by the launch of a new campaign or a new traffic source, or maybe you have changed a landing page or something else has shifted.
Anyway, you can ignore this spike while setting boundaries.
If there are a lot of spikes, due to your team working hard trying and testing a lot of things, you may end up deleting these days from your dataset.
How to set Hourly Alerts / Real-Time
Google Analytics allows you to set alerts on a daily, weekly and monthly basis.
Alerts: ideas and use cases
All site alerts - daily alerts
No Data
- All traffic → Visits → is less than: 1
- All traffic → Goal X Completions → is less than: 1
- Event Category = name of event → Total Events → is less than: 1
- All traffic → Revenue → is less than: 1
- All traffic → Transactions → is less than: 1
Traffic performance
Here and after we will use {value based on your data}
- Medium = cpc → Sessions → decreased by more than: value based on your data → Same day in the previous week
- Medium = cpc → Sessions → increased by more than: value based on your data → Same day in the previous week
- Medium = cpc → Users → decreased by more than: value based on your data → Same day in the previous week
- Medium = cpc → Users → increased by more than: value based on your data → Same day in the previous week
- Medium = cpc → Goal X Completions → decreased by more than: value based on your data → Same day in the previous week
- Medium = cpc → Goal X Completions → increased by more than: value based on your data → Same day in the previous week
- Medium = cpc → Revenue → decreased by more than: value based on your data → Same day in the previous week
- Medium = cpc → Revenue → increased by more than: value based on your data → Same day in the previous week
- Medium = cpc → Transactions → decreased by more than: value based on your data → Same day in the previous week
- Medium = cpc → Transactions → increased by more than: value based on your data → Same day in the previous week
It is highly recommended to repeat that set of alerts for every paid traffic source. It's also worth it to set the same set of alerts for organic, referral and direct traffic.
Site usage alerts
Site usage alerts can give you vital indications about a problem with a landing page, site navigation, broken links, etc.
I would consider setting these kinds of alerts for every paid traffic source as well as for your channels.
Here are a few examples:
- Medium = cpc → Bounce Rate → increased by more than: value based on your data → Same day in the previous week
- Medium = cpc → Avg. Session Duration → decreased by more than: value based on your data → Same day in the previous week
- Medium = cpc → Avg. Session Duration → increased by more than: value based on your data → Same day in the previous week
- Medium = cpc → Pageviews → decreased by more than: value based on your data → Same day in the previous week
If you have many traffic sources, but only a few landing pages, you can consider setting these alerts on your landing pages instead.E-commerce funnel alerts
If you are selling on your website you’ll probably want to track how well you’re doing at checkout.
For this, we suggest you set the following alerts:
All traffic → Add to cart rate
All traffic → Cart Abandonment Rate
All traffic → Checkout Abandonment Rate
The difference between “Cart Abandonment Rate” and “Checkout Abandonment Rate” is the stage at which a user leaves your website.
- Cart Abandonment Rate - user closed your website without opening the cart, but he/she did place a product in it.
- Checkout Abandonment Rate - refers to users that started the check-out process but didn’t make a purchase.
Easily manage your numerous alerts
If you are going to work with all of these alerts outlined above we would suggest you apply a naming convention.
Otherwise, it’s going to be hard to manage them!
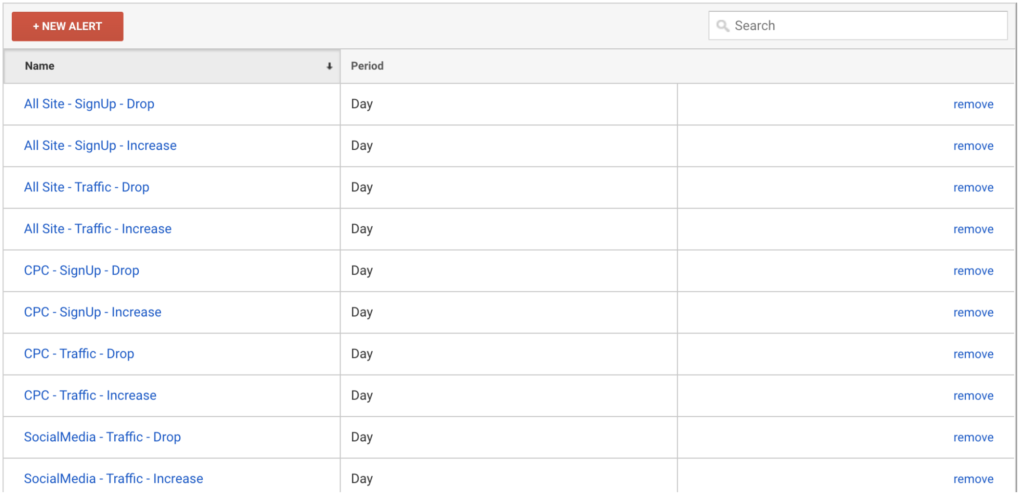
Here’s an example of a simple naming convention that you can use:
{Dimension Value} - {Metric} - {Increase | Drop}
- {Dimension Value} - is the value you specified in your dimension, it might be “all traffic” or “cpc” for the cpc channel. If you set an alert for a certain landing page you might consider using the landing page name here.
- {Metric} - this is the metric you’re setting alerts for: sessions, transactions, etc.
- {Increase | Drop} - specify whether it’s an alert for an increase or a decrease in the metrics
This is how it might lookin your settings: